MP1 EVR Presenter/dshowhelper community development (7 Viewers)

peque

Moderator - Spanish Forums
  • Premium Supporter
  • August 4, 2007
    861
    99
    Home Country
    Spain Spain
    Hi Tony,

    Could you please have a look at this piece of recorded TV from a DVB-t spanish channel?

    http://dl.dropbox.com/u/15222696/MP_20120315_23-28_TVE-HD Pruebas_Los Misterios De Laura.ts

    I'm having stuttering here and there trying to bitstream its EAC3 audio pid to my AVR (no problem if I decode EAC3 and pass plain 2 channel PCM to AVR)... Same .ts played with same video&audio decoders inside GraphStudio is working like a charm, so I must blame MP in some way...:rolleyes:

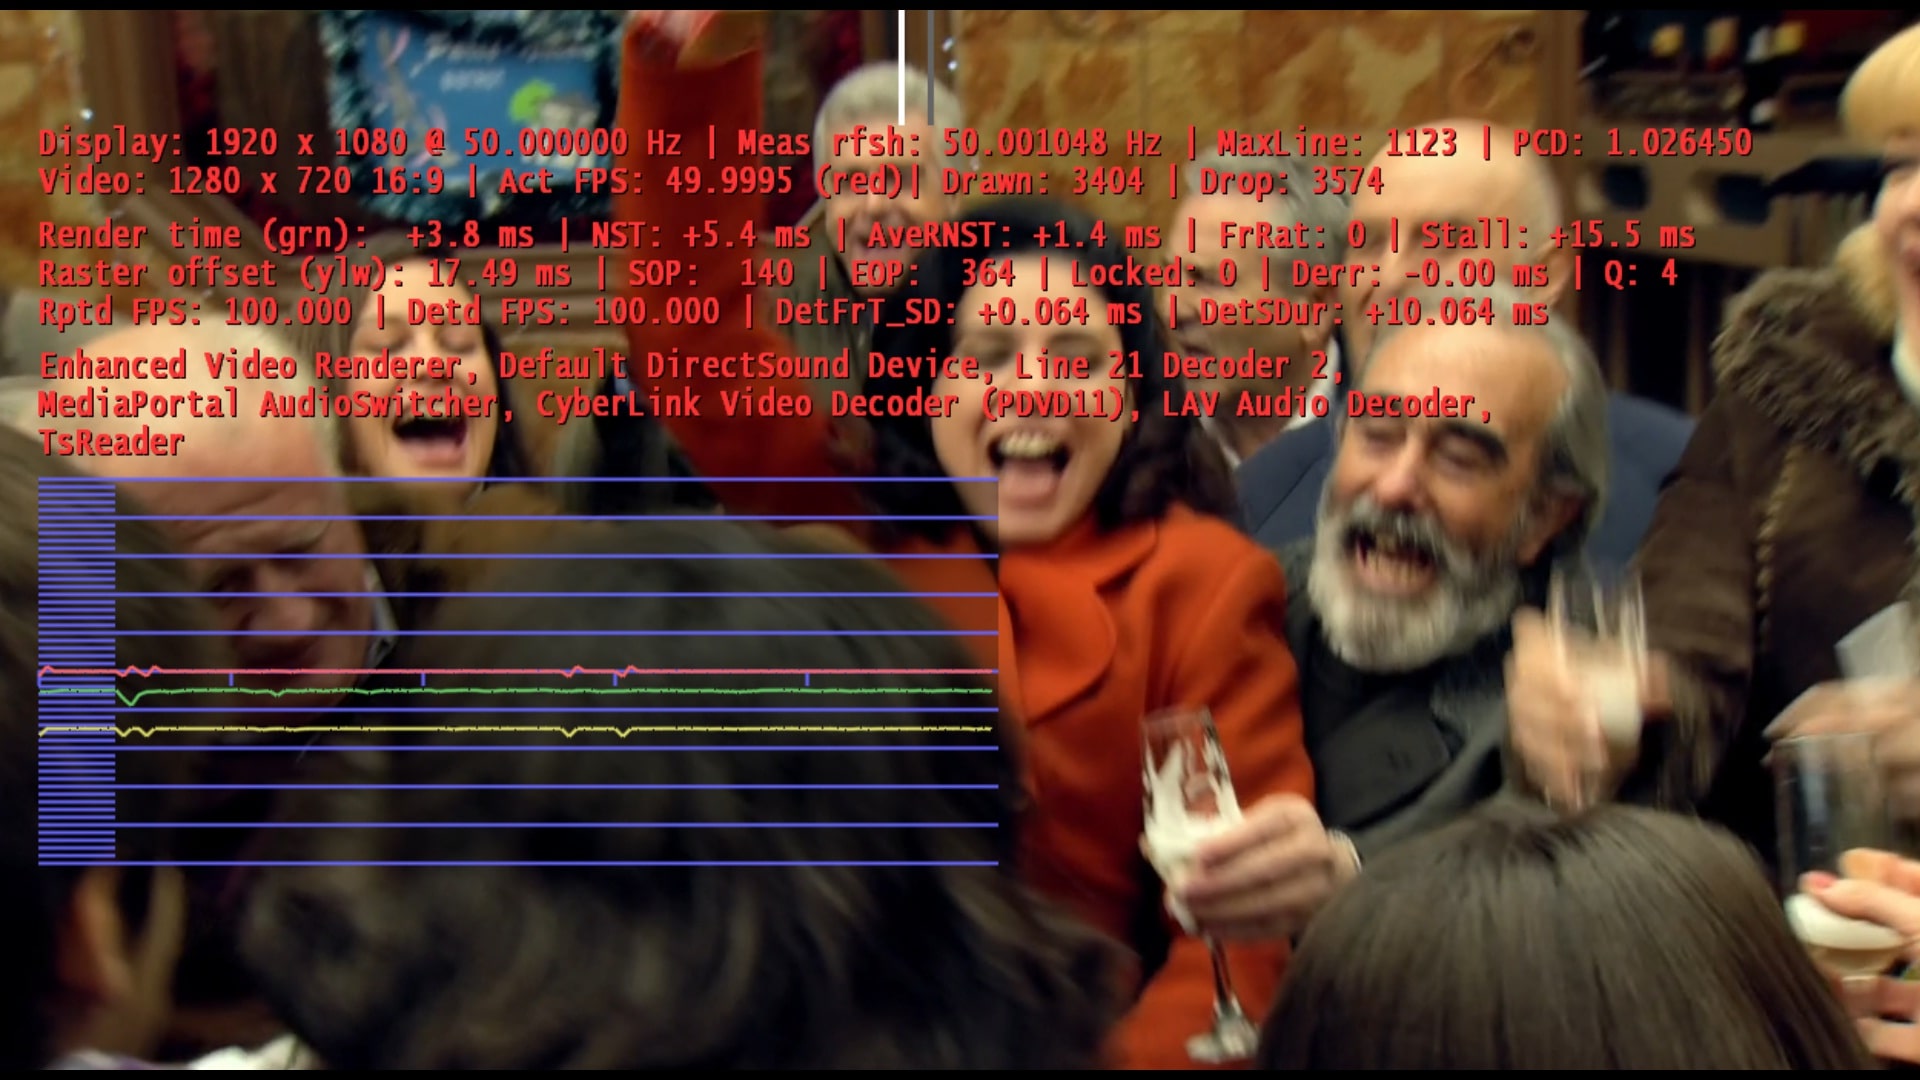
    Strange thing about this .ts inside MP is that dshowhelper stats (Alt+F1) display is showing 100 fps as reported and detected fps, which is obviously wrong and is leading to same drop as drawn frames (half of them, to match 50 fps). You can see them in attached shot.

    Does dshowhelper have something to do with this little mess?

    Thanks a lot.

    EDIT: Tested last v92 just in case it helped... no luck. :(
     

    Attachments

    • stats.jpg
      stats.jpg
      494.6 KB

    Owlsroost

    Retired Team Member
  • Premium Supporter
  • October 28, 2008
    5,540
    5,038
    Cambridge
    Home Country
    United Kingdom United Kingdom
    I don't think so (but you haven't provided any logs.....).

    It plays at 50 fps on my system with LAV, MS-DTV and PDVD11 video decoders (Rptd FPS is 100 with some of them, but Detd FPS is always 50). I can't test EAC3 bitstreaming.

    The 'PCD:' value looks a bit odd - is it stable at an average of 1.02 ? ('PCD:' is the ratio of filter graph clock time to real time)
    It should be stable at 1.00, unless it's being 'pulled' by ReClock or MP Audio Renderer. The 2% offset might be the cause of your stuttering.

    Tony
     

    peque

    Moderator - Spanish Forums
  • Premium Supporter
  • August 4, 2007
    861
    99
    Home Country
    Spain Spain
    It's stable in your system because you haven't tested bitstreaming, I asume... As I told you, if I configure audio decoder to decode and pass EAC3 audio PID as PCM to AVR (thus, no bitstreaming), I don't have stuttering.

    PCD goes between 0,99 and 1,03... I've tested another DVB-t spanish channel with an EAC3 pid, which I don't have stuttering watching at, and PCD is no goind beyond 1,00003... Also If I don't bitstream, this .ts stays around 1.

    I don't use ReClock or MP Audio Renderer... Then... what could be the cause of that offset in PCD? ¿?

    BTW, I always get 100 as Detected FPS (who is responsible for that number inside the filter chain?)... What changes in my system is Reported FPS, which is 50 for ffdshow audio decoder, and 100 for Lav Audio decoder (0.48)...

    Really odd all in all.. :(

    Thanks a lot. I'm sure TVE is broadcasting crap instead of standard formats... :(
     

    Owlsroost

    Retired Team Member
  • Premium Supporter
  • October 28, 2008
    5,540
    5,038
    Cambridge
    Home Country
    United Kingdom United Kingdom
    It looks like the audio renderer is doing something odd when bitstreaming that EAC3 stream (the audio renderer is normally the source of the graph clock - that's why it has a 'clock' icon in GraphStudio).

    Detected FPS is worked out by dshowhelper from the incoming video timestamps - if it's 100 FPS it probably means that the decoder is de-interlacing the video, even though it shouldn't because it's actually 720p progressive scan @ 50 FPS....

    Tony
     

    peque

    Moderator - Spanish Forums
  • Premium Supporter
  • August 4, 2007
    861
    99
    Home Country
    Spain Spain
    It looks like the audio renderer is doing something odd when bitstreaming that EAC3 stream (the audio renderer is normally the source of the graph clock - that's why it has a 'clock' icon in GraphStudio).
    Ok. I understand.

    Detected FPS is worked out by dshowhelper from the incoming video timestamps - if it's 100 FPS it probably means that the decoder is de-interlacing the video, even though it shouldn't because it's actually 720p progressive scan @ 50 FPS....

    Tony
    Oops... You have reminded me something... nevcariel implemented "aggresive" deinterlacing option in LAV Video decoder in response to a report from myself about another (this time SD) spanish DVB-t channel recording that wasn't correctly deinterlaced. He told me that the problem was that the recording was flagged as interlaced, but from time to time, the video frames weren't flagged, so deinterlacing was "lost" then. Here the explanation:


    http://forum.doom9.org/showthread.php?p=1538018&highlight=PeQuE#post1538018

    You have told me now that this recording is being deinterlaced even though it shouldn't... This must be because is flagged as interlaced, while actual frames are not... As I've got "aggressive deinterlacing" checked, I've got that 100 fps... I've tried deactivating it, and THEN I've got correct detected and reported 50 fps... :)

    Anyway, this doesn't solve my problem, as I've got maaany dropped frames anyway after solving that incorrect deinterlace, which corresponds to that stuttering I see...

    The thing is... If I reproduce point by point the dshow filter chain inside Graphstudio and play that .ts, I can't see any stuttering... :( So I can't blame anything outside MP... If you tell me dshowhelper isn't responsible... Where could I continue investigating?

    Thanks a lot.
     

    doveman

    Portal Pro
    February 12, 2008
    2,326
    178
    Home Country
    United Kingdom United Kingdom
    I'm probably completely off here, but whilst trying to get Skyrim to play nice, I noticed in XP my VRAM usage at idle was only about 10MB whilst in Win7 it was 80MB+. Testing seems to show that this is predominantly due to dwm.exe (Desktop Windows Manager, which gives us transparancy effects, Flip3D, etc). However it doesn't seem that dwm.exe and Aero are totally intertwined. If I switch to a Windows Classic or Basic theme it doesn't kill dwm.exe, but I can do that manually. It does restart itself a couple of times, but eventually it gives up and I can then switch back to an Aero theme without it restarting and my VRAM usage stays low. dwm.exe is also separate from the Desktop Window Manager Session Manager service, which is still running.

    I'm just wondering if whatever MP's dwm-dshowhelper depends on (or even the non-dwm one, I think I recall reading that MP needs Aero fullstop) is still available with dwm.exe killed as it's always nice to only have 10MB VRAM usage at idle rather than 80-100MB, but maybe there could be some benefit for MP as well.

    Getting off-topic now, but I read an interesting article about using Windows 7 Embedded to run a Media Centre HTPC, with all the benefits of having a more streamlined OS without unnecessary clutter, which sounded intriguing!
     

    peque

    Moderator - Spanish Forums
  • Premium Supporter
  • August 4, 2007
    861
    99
    Home Country
    Spain Spain
    I attach logs of something I've been watching myself for many time... Now it's time to ask you, if you don't mind... :)

    From time to time I see in stats a dropdown of render time (green line)... Normal render times in my system for a 1080i channel stays arround 4 ms (flat green line)... Well... from time to time (some minutes), render time suddenly goes to around 17 ms... I can't see any artifact or stutter, it's only noticeable if stats are active... Then render time stays there for some minutes more (also flat green line), and steps back to 4 ms... This time I allways get a dropped frame... These are my only dropped frames watching 1080i broadcasts... As I told you, it's only noticeable when going back to 4 ms, so it doesn't annoy me much... That's why I haven't come here before.

    Question is: could be hardware related? I don't think my GT240 should have any problem hardware-deinterlacing these broadcasts... but may be you can help to find the origin of this.

    I've been suffering this across many driver versions and decoders, so I asume it's not the problem.

    Also I'm using dshowhelper v55f, so I can't avoid any problem with these tests versions.

    I attach the evr.log with some of these steps up/down in render time... I don't think it's useful, as there you can only see the dropped frames caused by that steps up/down...

    Thanks a lot!!
     

    Owlsroost

    Retired Team Member
  • Premium Supporter
  • October 28, 2008
    5,540
    5,038
    Cambridge
    Home Country
    United Kingdom United Kingdom
    I attach logs of something I've been watching myself for many time... Now it's time to ask you, if you don't mind... :)

    From time to time I see in stats a dropdown of render time (green line)... Normal render times in my system for a 1080i channel stays arround 4 ms (flat green line)... Well... from time to time (some minutes), render time suddenly goes to around 17 ms... I can't see any artifact or stutter, it's only noticeable if stats are active... Then render time stays there for some minutes more (also flat green line), and steps back to 4 ms... This time I allways get a dropped frame... These are my only dropped frames watching 1080i broadcasts... As I told you, it's only noticeable when going back to 4 ms, so it doesn't annoy me much... That's why I haven't come here before.

    Question is: could be hardware related? I don't think my GT240 should have any problem hardware-deinterlacing these broadcasts... but may be you can help to find the origin of this.

    I've been suffering this across many driver versions and decoders, so I asume it's not the problem.

    Also I'm using dshowhelper v55f, so I can't avoid any problem with these tests versions.

    I attach the evr.log with some of these steps up/down in render time... I don't think it's useful, as there you can only see the dropped frames caused by that steps up/down...

    Thanks a lot!!


    This was one of the problems that got me started on this whole development thread a long time ago.....

    What happens is that Windows will sometimes block the rendering until the next vsync (which shows up as the long render time), then sometime later it seems like a pipeline gets unblocked and it returns to normal.

    I've never managed to work out why (and I've tried all sorts of ideas to fix/work around it). It got much less frequent when the vsync correction was added, but it still happens sometimes - and it sometimes seems worse with 24Hz video...

    Tony
     

    peque

    Moderator - Spanish Forums
  • Premium Supporter
  • August 4, 2007
    861
    99
    Home Country
    Spain Spain
    Ok Tony. I'm not alone then... :p

    Iis that vsync correction you mention implemented in standard v55f dll?
     

    Owlsroost

    Retired Team Member
  • Premium Supporter
  • October 28, 2008
    5,540
    5,038
    Cambridge
    Home Country
    United Kingdom United Kingdom
    Ok Tony. I'm not alone then... :p

    Iis that vsync correction you mention implemented in standard v55f dll?


    Yes.

    In the render stats, 'SOP:' is the video scan line (counting from the top - zero count is vsync time) when it 'presents' the frame for rendering, 'EOP:' is the scan line when Windows hands back control - if you have the long render time problem the EOP number is normally lower than SOP because control isn't returned until after the next vsync.

    Tony
     

    Users who are viewing this thread

    Top Bottom